The Efficiency Curve: How to Find Your Brand’s Optimal CTV Mix [Infographic]
Pinpoint the most efficient balance between CTV and linear to cut wasteful exposures and drive optimal results.
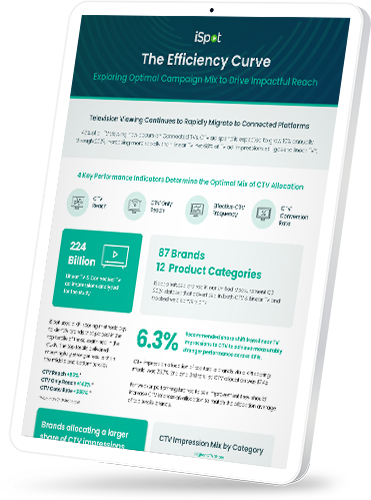
CTV captures 46% of all TV viewing, yet linear still commands 68% of impression*. That’s a lot of budget that might not be working as hard as it could be.
To figure out what’s really driving results, iSpot partnered with LG Ad Solutions and ran a cross-platform study using iSpot’s Unified Measurement–which tracks ad performance across linear, streaming and social video in one clean view.
The mission: Find the maximum efficiency point where CTV and linear TV deliver optimal performance while eliminating wasteful exposure.
Analyzing 222.4 billion impressions across 87 brands and 12 industries revealed modest allocation shifts unlock significant gains in reach, frequency, and conversions.
Download The Efficiency Curve infographic for CTV impression mix benchmarks and strategic allocation recommendations that can transform your media performance.
*Source: eMarketer, November 2024

Key Takeaways Include:
- Brands need precision in media planning to optimize CTV and Linear TV performance while minimizing waste.
- Optimal CTV allocation builds reach and frequency proportionally, unlike linear TV's excessive frequency buildup.
- Top performers see varying CTV results by campaign size and category, requiring tailored impression allocation strategies.