As kickoff for the 2026–2027 NFL season closes in, brand strategy teams are fine-tuning their game plans for television’s most valuable live audience.
From Peyton Manning leading spokesperson airings and QSRs driving top ad Likeability to Wingstop achieving a +20.9% conversion lift, look back at what actually moved the needle during the 2025–2026 regular season.
Most-Seen Advertisers
Dominating game day requires consistent, high-impact exposure that outpaces category rivals. The top-ranked brands leveraged massive share of voice to capture billions of impressions and keep their messaging front-and-center throughout the broadcasts.
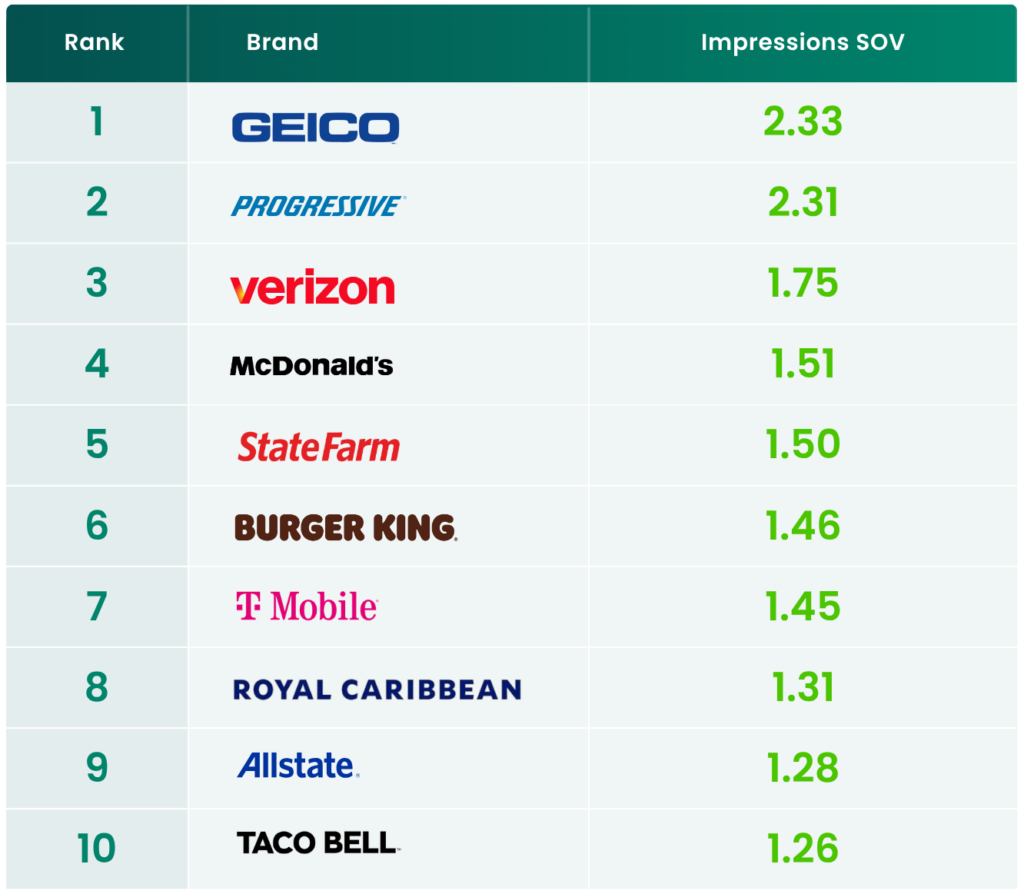
TV Ad Impression Share of Voice (SOV): The percentage of impressions generated by a brand or ad compared to the total impressions generated by the selected criteria.
Roster Intelligence: Top Talent by Airings
Star power commands instant attention and with the right fit, athletes can help advertisers turn airtime into long-term brand equity.
But heavy broadcast rotation risks viewer fatigue. While marquee names like Peyton Manning and Saquon Barkley offer broad, multi-brand reach, high airing volume isn’t the only route to success—focused alignments with heavy anchor-brand concentration (like Travis Hunter with Celsius) offer high category dominance.
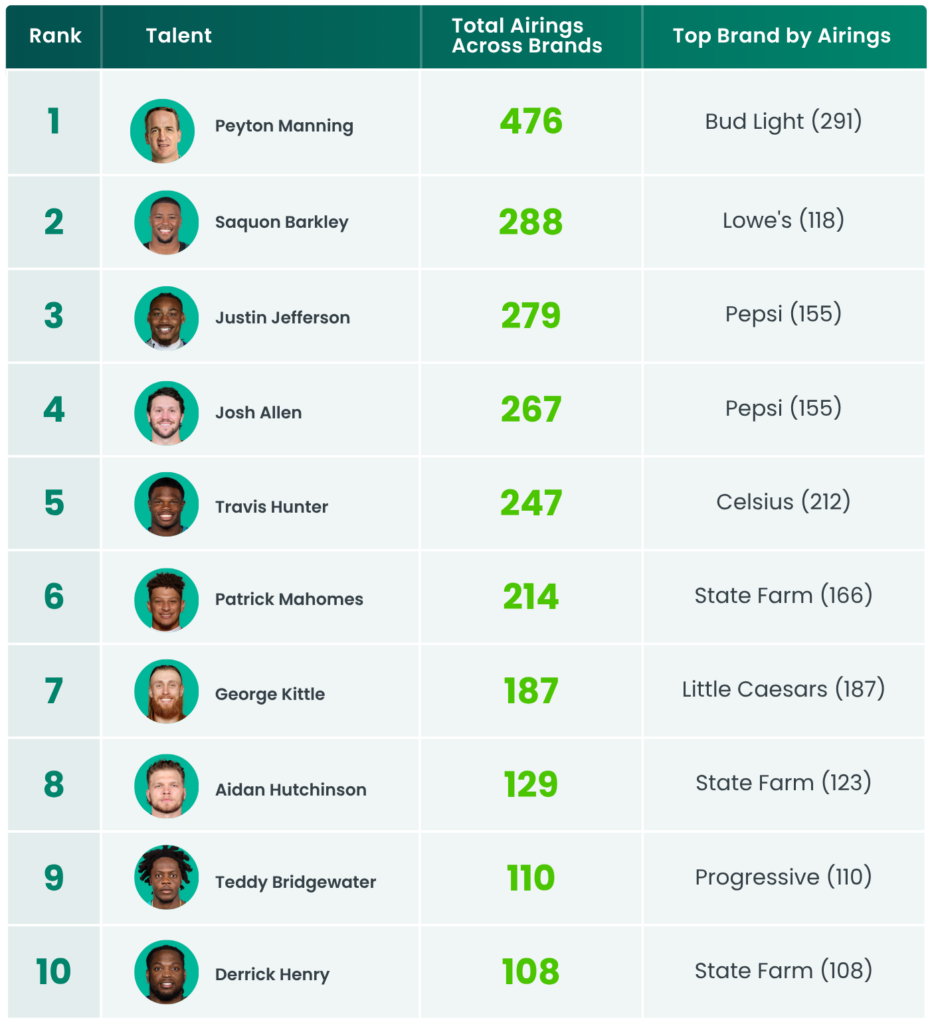
- Peyton Manning (476 Airings): Proves legendary alumni remain spokesperson powerhouses, led by high-rotation spots for Bud Light (291) and Nationwide (177).
- Saquon Barkley (288 Airings): Operates with the league’s most versatile active portfolio, spanning Lowe’s (118), Little Caesars (66), Nike (40), and Nationwide (35).
- Justin Jefferson (279 Airings): Anchors high-visibility campaigns for Pepsi (155) and Lowe’s (99).
- Josh Allen (267 Airings): Drives a multi-category presence spanning Pepsi (155), SoFi (25), Gatorade (23), and Snickers (21).
- Travis Hunter (247 Airings): Demonstrates the strength of singular brand alignment, powered almost entirely by Celsius (212 airings).
- Patrick Mahomes (214 Airings): Powers core creative messaging for State Farm (166) and Invisalign (47).
Creative Breakdown: Top 10 Ads by Likeability
High broadcast volume gets you noticed, but memorable creative keeps you top-of-mind. The top-performing NFL spots combined sharp value props with situational humor to beat the all-industry norm (610) during the the NFL regular season and playoffs by up to 20%.
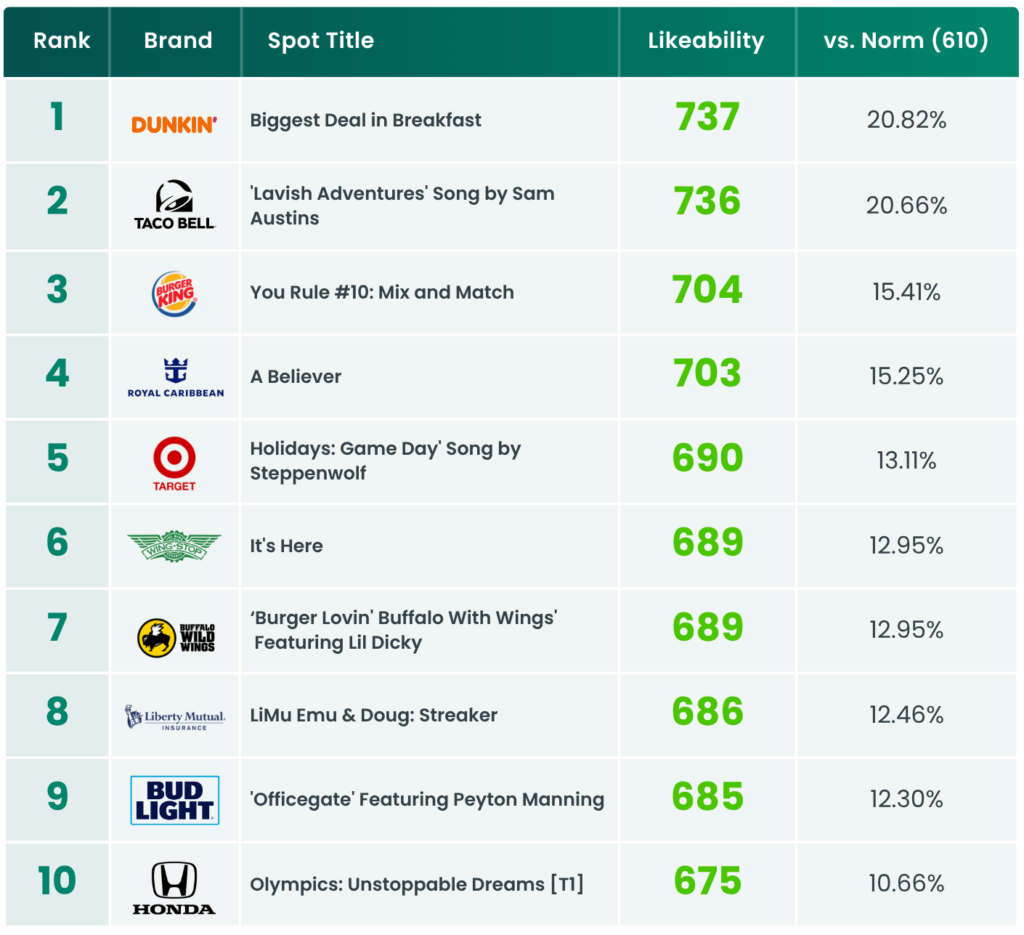
Likeability Score: Measures the extent to which survey respondents like an ad. Scores range from 1-950. A difference of +/-25 points is statistically significant.
- Food & Value Rule Game Day: Quick-Service Restaurants claimed 5 of the top 7 spots. Appetizing food visual cues tied directly to accessible price points (e.g., Dunkin’s $6 Meal Deal or Taco Bell’s Luxe Cravings Box) tapped straight into game day ordering habits.
- Situational Humor Drives Memory: High performers like Liberty Mutual’s “Streaker” (686) and Bud Light’s “Officegate” (685) leaned into light comedy, giving viewers a shared laugh during high-stress game breaks.
Outcomes Spotlight: Wingstop’s Direct Conversion Model
The ultimate test of ad performance is whether the creatives and placements translate directly into measurable consumer action. Wingstop’s cross-network execution across CBS, NBC, Fox, and ESPN during the season provided a prime template for driving lower-funnel results:
- Massive Scale: Generated 6.62 million total foot traffic converters during in-season ad airings across CBS, NBC, Fox, and ESPN.
- Significant Incremental Lift: Delivered 421K incremental converters—representing a +20.9% conversion lift among exposed households compared to an unexposed control group.
- Low Frequency Needed: 50% of exposed households that converted saw 2 or fewer impressions prior to visiting Wingstop.
Connect Game Day to Business Outcomes
Backed by iSpot’s identity spine across 132 million U.S. households, we help advertisers move beyond impression share to measure what actually drives the bottom line.
Stop relying on exposure alone or manually cobbling together reports. Connect your creative and audience reach directly to the results that move your business forward.
Read iSpot’s POV on outcomes to dive into the full measurement framework.