
A Look at How Ad Viewership Transformed During the Pandemic
If you are in the business of buying or selling TV advertising, the recent issues involving “understated” audiences is more than just cause for concern; for many, it has generated calls to action. Discovery wants money back, the VAB wants an audit, NBCUniversal is reminding the market about the importance of trust.
Accurate measurement matters — especially for networks selling ad inventory based on gross ratings points for programs, and for those brands buying audiences against specific programming and time slots. However, while so much of the public chatter right now is about program and day-part ratings, the conversations with brands have more to do with the metrics they care about and how data generated from their investments can be tracked and measured persistently and reliably.
Despite the many disruptions during the pandemic, iSpot’s system did just that. And the results run counter to a prevailing narrative. While TV viewership for programming diminished, the amount of chances brands had to reach households actually increased.
Below is a collection of charts utilizing the iSpot Ad Rating, a measure of total households where at least one TV had a verified exposure to a given TV ad. The verification is done by the on-screen detection of the ad play in 18M homes, balanced and extrapolated to the U.S. Census. The Average Ad Rating is the average of all ad units for a particular date and daypart for a given network.
Year-Over-Year Average Ad Ratings Were Up 7.6%

(Avg. ad rating across networks, linear + streaming programming, Jan. 1-Dec. 31, 2019 vs. Jan. 1-Dec. 31, 2020)
- Average ad impression volumes were up to begin with in 2020, but really diverged in March — staying above 2019 levels on a month-by-month basis until September, when many kids returned to school.
- The largest YoY increase was in August (25.9%), fueled in part by the NBA’s return (August is typically a lighter month for premium content).
Before we share more interesting trends using iSpot’s always-on TV ad measurement, first consider why and how validating every ad across platforms can provide both the buy and sell side a more accurate, reliable system for exchanging value.
Using modern measurement from iSpot, the industry can better discover the truth about TV audiences. But what does modern measurement look like? We focus on three main components:
Scale: We utilize a large panel of TV ad data that requires no in-home calibration or maintenance. Our panel is calibrated against multiple forms of measurement, including set-top box, smart TV, person-level panels, census data, device graphs and household demographics. The result is a representative view of TV audiences that’s future-proof (and pandemic-proof), allowing brands, agencies and networks to make decisions with confidence.
Measure Ads, Not Programs: Ads are increasingly getting decoupled from programs given the continued growth in streaming and addressable in environments. The only way to get accurate measurement is on-the-glass verification of ads. iSpot is the only company that detects all ads across a massive (18 million) footprint of TVs. Competitors are still relying on programs first to measure advertising — even those that also use smart TV data.
Count All Forms of TV: The nature of TV isn’t static, so why should measurement be? Today, TV ad measurement must account for linear, streaming, addressable, cable, over-the-air, set-top box and various forms of streaming devices. iSpot is the only company able to detect ads across all of these formats to present a full picture on when and where creative appeared, and its performance relative to audience attention, effectiveness and business outcomes.
For Most of 2020, Average TV Ad Impressions Were Up on a Daily Basis

(Avg. ad rating across networks, linear + streaming programming, Jan. 1-Dec. 31, 2019 vs. Jan. 1-Dec. 31, 2020)
- Day-to-day, 2020 had an advantage over 2019 right off the bat by impressions, peaking in November around the presidential election and resulting coverage.
- Interestingly, and despite lockdowns resuming in many states, TV ad impressions were largely at parity in 2020 and 2019 over the last month and a half of the year.
Primetime TV Ad Ratings Were Up 1.2%, Lagged in Q4

(Avg. primetime ad rating across networks, linear + streaming programming, Jan. 1-Dec. 31, 2019 vs. Jan. 1-Dec. 31, 2020)
- Fueled by more TV ad impressions in summer (thanks to the return of sports), primetime impressions were still up in 2020, albeit barely.
- With uneven TV season return, Q4 TV ad impressions in primetime started down and remained there.
The NBA’s Return Drove a 35.1% TV Ad Ratings Increase for League-Affiliated Channels (including ABC)
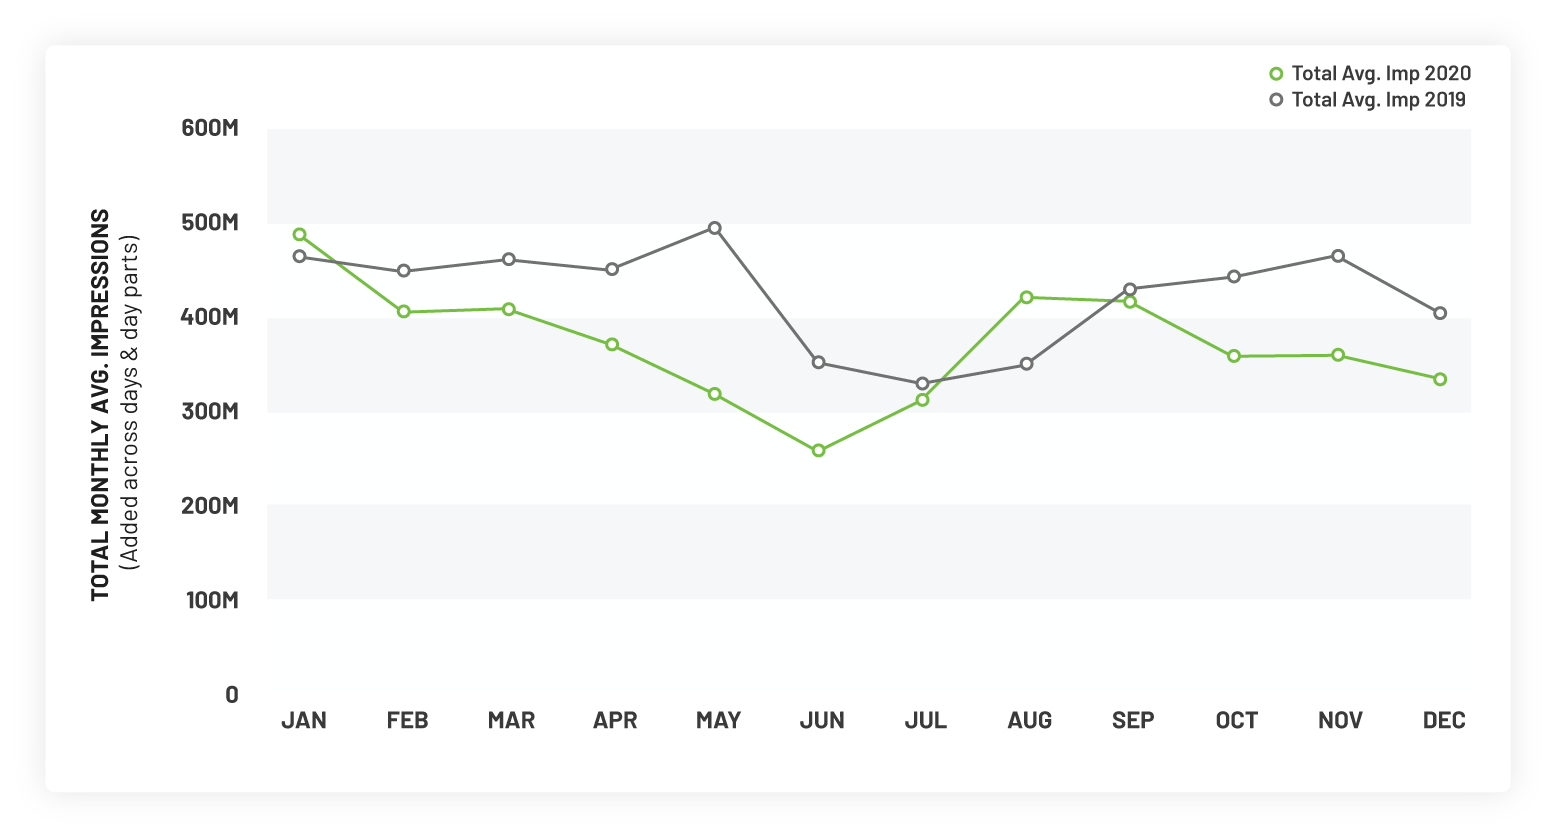
(Avg. ad rating across ESPN, ESPN2, ABC, TNT, linear + streaming programming, Jan. 1-Dec. 31, 2019 vs. Jan. 1-Dec. 31, 2020)
- The absence of sports — especially basketball — meant impressions plummeted on NBA partner channels like ESPN, ESPN2, TNT and ABC from March through July.
- With the NBA returning in late July, however, there was a clear uptick in August TV ad impressions in light of live games airing and highlight shows having more to discuss.
Cable News TV Average Ad Impressions Were Up 63.5% On the Year, and 68.4% in November

(Avg. ad rating across CNN, Fox News, MSNBC linear + streaming programming, Jan. 1-Dec. 31, 2019 vs. Jan. 1-Dec. 31, 2020)
- With the presidential election cycle getting started early, TV ad impressions for cable news were bound to be up — and were to start the year.
- That increase was only increased by the pandemic, the contentious election lead-up and aftermath, as well as news coverage of social unrest over the summer.
Despite No NCAA Tournament, Turner TV Ad Impressions Were Up by 33.6%

(Avg. ad rating across CNN, TBS, TNT, truTV linear + streaming programming, Jan. 1-Dec. 31, 2019 vs. Jan. 1-Dec. 31, 2020)
- Though Turner (TNT, TBS, truTV) lost the NCAA Men’s Basketball Tournament last year due to the pandemic, elsewhere in the WarnerMedia empire CNN’s coverage of COVID-19, social unrest and the election continued to fuel a TV ad impressions uptick.
- Turner impressions actually peaked in August upon the NBA’s return to TNT, but election coverage on CNN nearly equaled that come November.
DIY TV Ad Impressions Jumped 42.5%, Fueled by More Time at Home, Contact Concerns
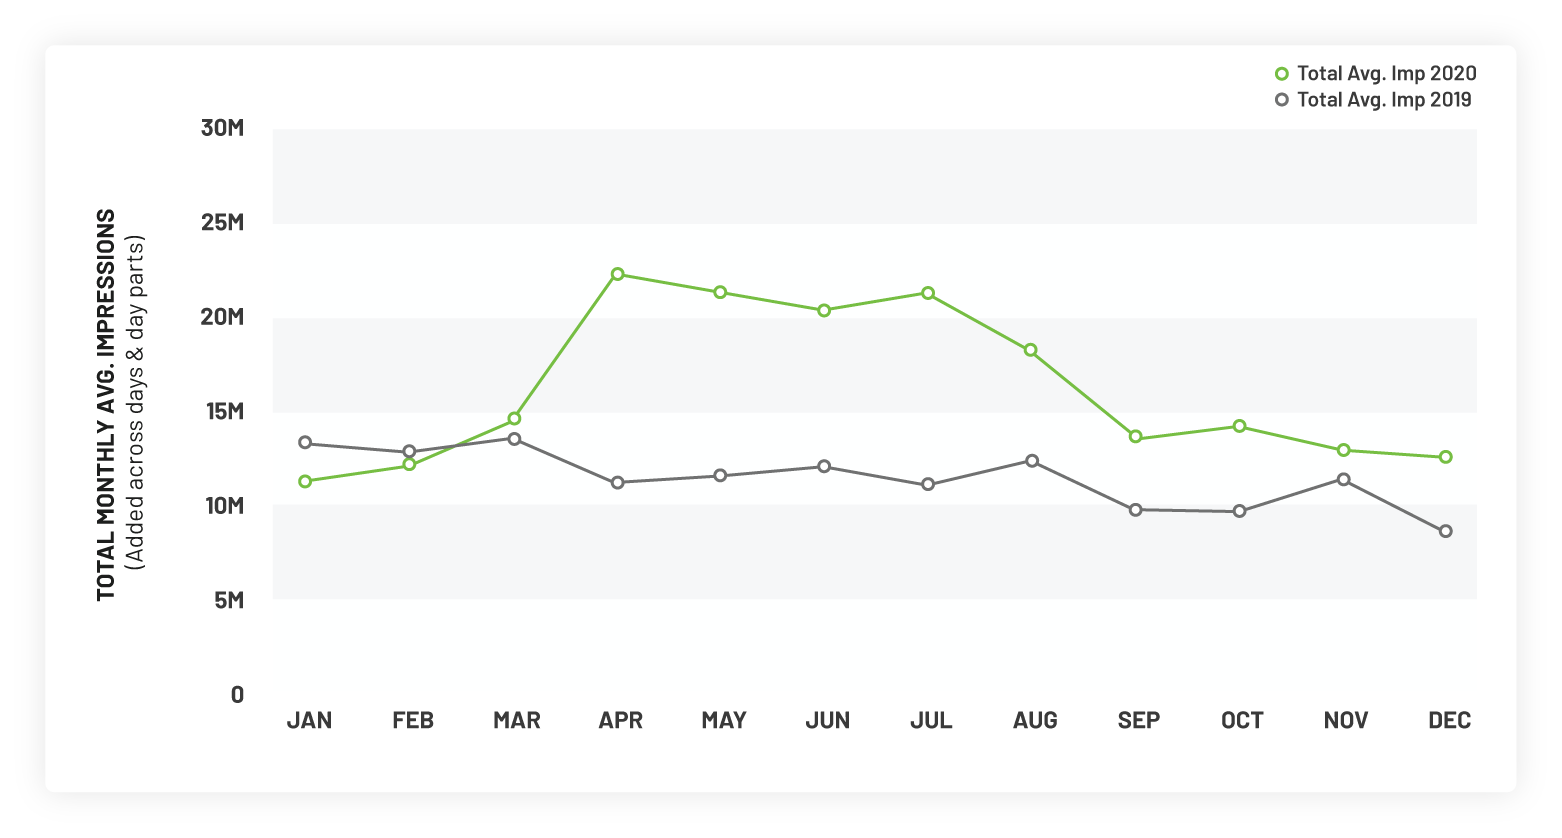
(Avg. ad rating across DIY linear + streaming programming, Jan. 1-Dec. 31, 2019 vs. Jan. 1-Dec. 31, 2020)
- During the pandemic, audiences in part flocked to niche cable content like what appears on DIY.
- As was the case for many cable channels, DIY TV ad impressions peaked early in the pandemic (April), and remained well above 2019 totals month over month for the remainder of 2020.
Across All Discovery Inc. Channels, TV Ad Impressions Were Up 9.8%

(Avg. ad rating across Discovery-owned linear + streaming programming, Jan. 1-Dec. 31, 2019 vs. Jan. 1-Dec. 31, 2020)
- Across its various cable channels, Discovery TV ad impressions peaked in August (following cable content overall).
- HGTV (up 7.3% on the year) and Food Network (up 8.4%) experienced some of the largest year-over-year increases for Discovery, though they trailed DIY’s 42.5% bump.
Want more insights around how TV ads successfully got in front of audiences in 2020? Reach out to iSpot’s Media Partnerships team to learn about how impressions migrated, and how you can use that data to inform your own decisions going forward.