
The first half of 2019 is officially over. Let’s take a look at top-line trends for the industries spending the most on TV advertising. The data below covers Jan. 1 through Jun. 30.
Top Ten Rankings by Industry

Key Insights:
- The Top Five ranking of industries that spent the most did not change from 2018 to 2019 (in order, by estimated spend: auto makers, auto and general insurance, quick-serve restaurants, wireless companies and movie studios).
- Slow the Car: Auto makers accounted for 7.8% of spending on TV ($2.6B). While remaining the top industry, automakers have pulled back roughly 11% of spend year over year. They are also pushing the most creative: of the top five industries advertising on TV, auto makers ran more spots than any other type of marketer.
- Insurance, Wireless Pick Up: a surge in spending comes from the carriers, up nearly 15% year over year and Insurance up 6.7%.
- Viewers were most likely to see an ad from a TV network, there were 2.47 million promo airings accounting for 14% of all TV device impression time. Fun facts: Pizza and beer companies were almost tied with 49 billion TV impressions in the first half of the year.
- Breaking Top 20: looking at the top 20 industries spending the most in the first half of 2019, there are a few new ones from 2018’s ranking – banking and payments services, snack foods, psoriasis, skin & nails pharmaceutical products, and online and auction websites.
- Airings for the largest advertisers were also on the rise, as brands make up for a loss in linear viewership by increasing frequency.
Ad Airings Increased for All Five of these Industries YOY

Top Five Industries Ranked by TV Spend (Jan. 1 – Jun. 30)
1. Vehicles: Auto Makers
- Total Estimated Spend: $2.64B
- Top Brand by Estimated Spend: Toyota (est. $263.3M)
- Total TV Ad Impressions: 206.6B
- Total Spots: 2,420
- Total Airings: 537,996
- Top Networks by TV Ad Impressions: ESPN, CBS, NBC
- Top Networks by Estimated Spend: CBS, NBC, ABC
- Top Programming by TV Ad Impressions: SportsCenter, 2019 NBA Finals, 2019 NCAA Basketball Tournament
- Top Programming by Estimated Spend: NFL Football, 2019 NCAA Basketball Tournament, NHL Hockey
Most-Seen Spot: Buick’s “Mistaken Identity” (3.4B TV Ad Impressions)
Spot with Best iSpot Attention Score*: Honda’s “Usual Car Dealer Stuff” (Spanish-language version) (98.87)

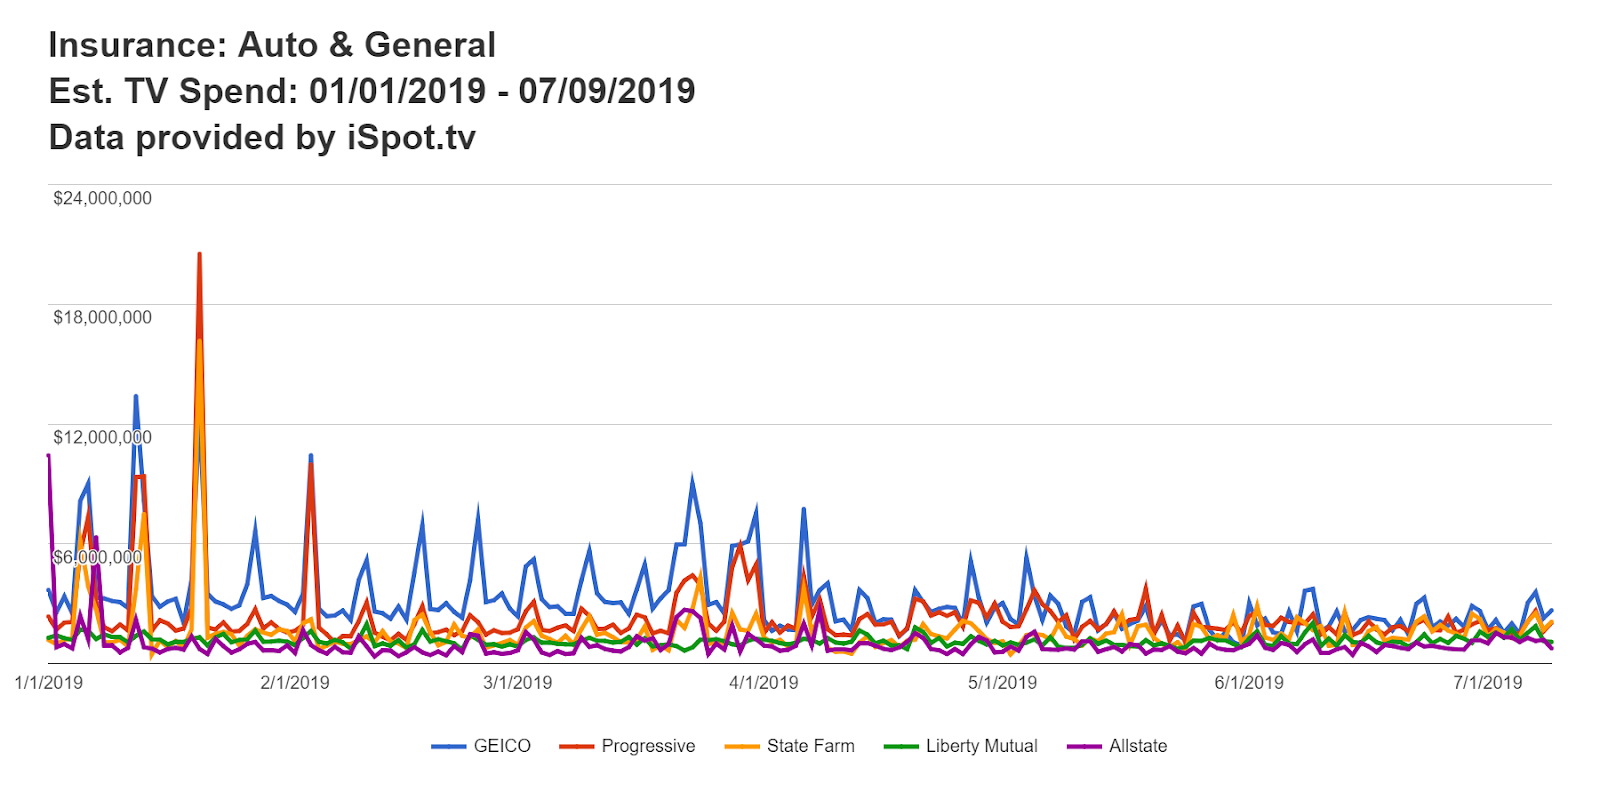
2. Insurance: Auto & General
- Total Estimated Spend: $2.18B
- Top Brand by Estimated Spend: GEICO (est. $586.7M)
- Total TV Ad impressions: 143.6B
- Total Spots: 555
- Total Airings: 829,753
- Top Networks by TV Ad Impressions: CBS, ESPN, Fox News
- Top Networks by Estimated Spend: CBS, NBC, Fox
- Top Programming by TV Ad Impressions: NFL Football, 2019 NBA Finals, SportsCenter
- Top Programming by Estimated Spend: NFL Football, 2019 NCAA Men’s Basketball Tournament, 2019 NBA Finals
Most-Seen Spot: USAA’s “Military Families” (5.1B TV Ad Impressions)
Spot with Best iSpot Attention Score: GEICO’s “2019 March Madness: ‘You Don’t Want This Smoke’ Featuring Ernie Johnson Jr.” (98.54)
3. Restaurants: Quick-Serve
- Total Estimated Spend: $1.67B
- Top Brand by Estimated Spend: McDonald’s (est. $295.9M)
- Total TV Ad Impressions: 149.9B
- Total Spots: 993
- Total Airings: 726,831
- Top Networks by TV Ad Impressions: ESPN, CBS, TNT
- Top Networks by Estimated Spend: CBS, ESPN, ABC
- Top Programming by TV Ad Impressions: 2019 NBA Finals, SportsCenter, NFL Football
- Top Programming by Estimated Spend: 2019 NBA Finals, NFL Football, 2019 NCAA Men’s Basketball Tournament
Most-Seen Spot: Taco Bell’s “Tasty Illusion” (2.3B TV Ad Impressions)
Spot with Best iSpot Attention Score: Jack in the Box’s “It’ll Make Everyone a Fish-Lover” (99.37)

4. Electronics & Communications: Wireless
- Total Estimated Spend: $1.66B
- Top Brand by Estimated Spend: AT&T Wireless (est. $362.2M)
- Total TV Ad Impressions: 89.6B
- Total Spots: 523
- Total Airings: 375,835
- Top Networks by TV Ad Impressions: ESPN, NBC, CBS
- Top Networks by Estimated Spend: CBS, NBC, ABC
- Top Programming by TV Ad Impressions: NFL Football, 2019 NBA Finals, 2019 NCAA Men’s Basketball Tournament
- Top Programming by Estimated Spend: NFL Football, 2019 NBA Finals, 2019 NCAA Men’s Basketball Tournament
Most-Seen Spot: Sprint’s “Decide for Yourself” (2.5B TV Ad Impressions)
Spot with Best iSpot Attention Score: T-Mobile’s “Lyfted” (99.01)

5. Life & Entertainment: Theatrical Movies
- Total Estimated Spend: $1.19B
- Top Brand by Estimated Spend: Universal Pictures
- Total TV Ad Impressions: 79.4B
- Total Spots: 551
- Total Airings: 244,873
- Top Networks by TV Ad Impressions: ABC, ESPN, NBC
- Top Networks by Estimated Spend: CBS, NBC, ABC
- Top Programming by TV Ad Impressions: 2019 NBA Finals, SportsCenter, Today 1
- Top Programming by Estimated Spend: 2019 NBA Finals, NFL Football, Super Bowl LIII
Most-Seen Spot: DreamWorks Animation’s “How to Train Your Dragon: The Hidden World” (2.9B TV Ad Impressions)
Spot with Best iSpot Attention Score: Lionsgate’s “Scary Stories to Tell in the Dark” (99.60)

*The iSpot Attention Score measures the average percentage of an ad that is played across a TV device.