
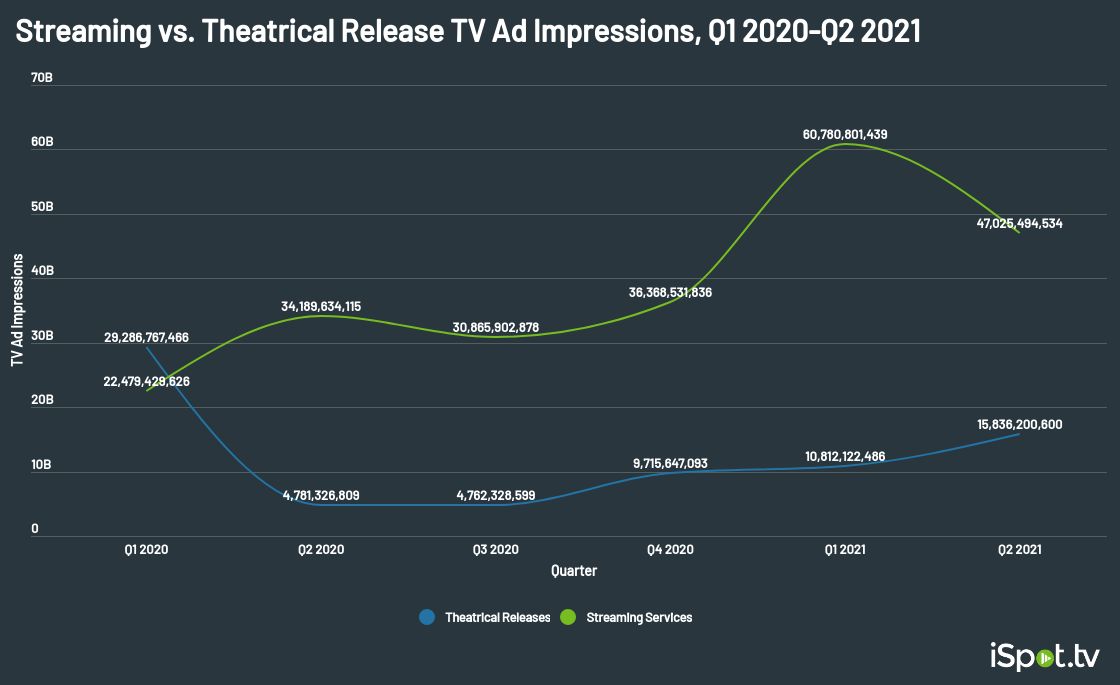
Even as movie theaters open up again in the middle of 2021, entertainment is still looking at a very different environment today than the status quo at the start of 2020. After theatrical movie releases led streaming service TV ad impressions during Q1 of 2020, streaming services have led the way ever since — and by a considerable margin, too.
The chart below shows the stark contrast between the two industries as they diverge in Q2 2020 and then continue from there before what appears to be the onset of a “return to normal” a year later, in Q2 2021.
Of course, much has happened since the start of 2020, too. And what comprised streaming when this chart began was wildly different from what you’d observe now.
While streaming’s initial surge was partially due to pandemic-related shortages of live sports, primetime TV and theatrical releases, that gave way to a whole new collection of streaming services, too. Except this time, many of those were directly associated with TV networks — as was the case with HBO Max, Peacock, Paramount+ and Discovery+.
The enormous increase in TV ad impressions in Q1 takes its cues directly from Discovery+’s arrival — not just as a streaming service, but as a replacement for Discovery-owned linear TV promos. During Q1, Discovery+ was the most-seen advertiser — streaming or otherwise — on TV, with 35.2 billion ad impressions (1.9% of all impressions during the timeframe).
Discovery+ kept it up, for the most part, in Q2 2021 as well. Below is a look at how streaming service impressions progressed from the start of 2020 through the end of Q2 2021.
(this is not the top services by impressions for the time period, but a look at notable services over time)
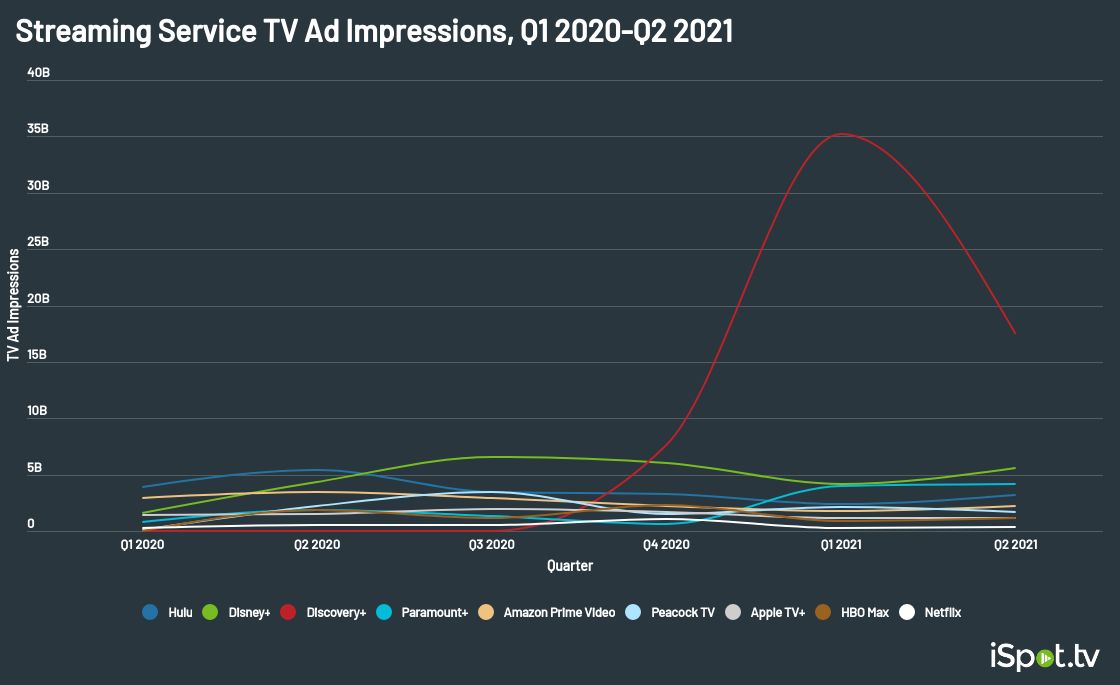
Discovery+ quickly emerges above the other streaming services from an impressions standpoint, which skews the visualization. So the chart below shows streaming service impression growth over time, without Discovery+ included.
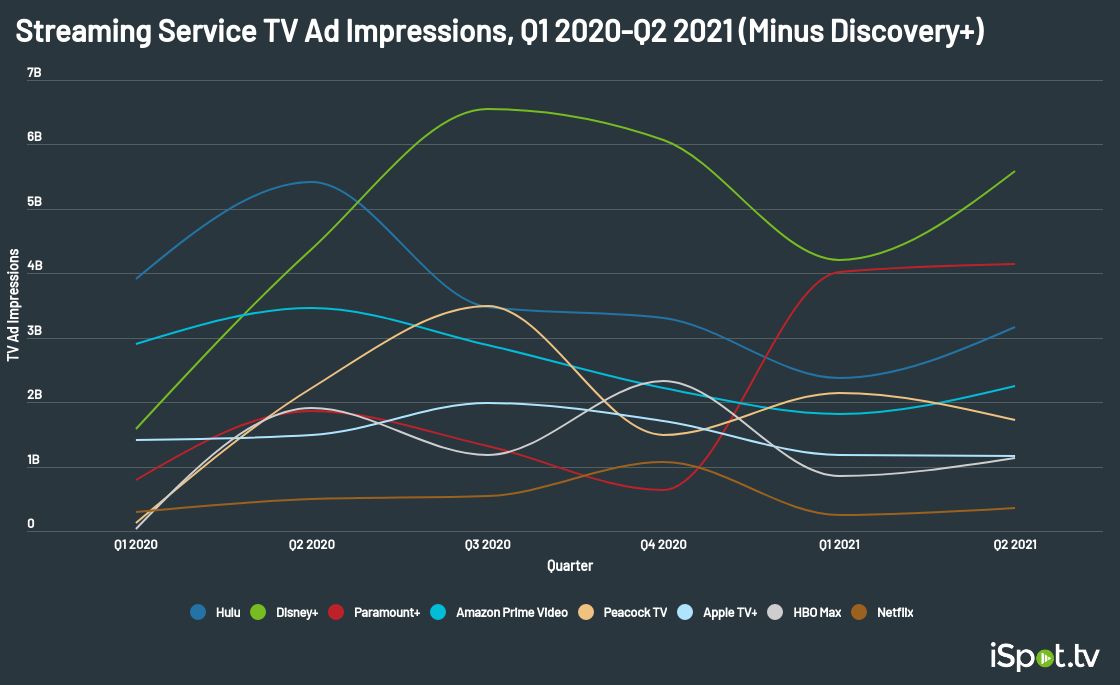
Disney+ quickly jumped at the opportunity to get in front of consumers with thousands of hours of known IP and library content, then increased impressions once again as 2021 started and original Marvel shows hit the platform. Paramount+ impressions include CBS All Access prior to the name change, but you also see a real push starting in Q1 as a potential long-term alternative to ViacomCBS linear TV content.
For movies, 2020 jumped out to a strong start before cooling down considerably until Q4, when signs of a turnaround began to emerge. Theatrical releases increased TV ad impressions 11.3% from Q4 2020 to Q1 2021, but 46.5% from Q1 to Q2. Much of that was back loaded, too. Theatrical releases had 2.0 billion TV ad impressions in April 2021, then 6.0 billion in May, before 7.8 billion in June as theater reopenings were more widespread.
In the first half of 2021, eight of the top 10 movie trailers by TV ad impressions featured at least some sort of streaming component (the exceptions were F9 and Peter Rabbit 2: The Runaway), and the same was true of the top 10 trailers for Q2. Even late in Q2, movies affiliated with media conglomerates that own streaming services were likely to have some sort of streaming element to releases, while those that weren’t moved away from on-demand viewing to embrace box office receipts.
Despite theaters reopening, studio streaming affiliation is still the most likely gauge for whether or not there’s a streaming element to movie releases. What’ll be worth watching is how long that continues into Q3 and beyond. In June, streaming service TV ad impressions remained nearly double the number for theatrical releases, though. So it appears there’s still more room for movies to grow back to “normal” levels.